Written by Chris; Chris is available for private tutoring.
IMPORTANT NOTE: to make best use of this blog post, please have a hard copy of the fourth edition of the IB Data Booklet available to you.
This is the second of 2 blogs on the IB® Chemistry Data Booklet.
Table 18 – Lattice Enthalpies: as previously mentioned, be aware of the matrix-like nature of this table to ensure you know how to use it. I should also point out that in my version of the data booklet, one of the plimsolls (⦵) has come out as the symbol Ö by mistake so don’t suddenly go thinking this is a new symbol you’ve not seen before.
The process described in the text for this table is a bit misleading. Currently it is written as:
MaXb(s) → aMb+(g) + bXa+(g)
which holds true except when M and X are 2+/2- or 3+/3- ions such as in calcium oxide (CaO) or aluminium phosphide (AlP). In this case it appears that the values for a and b are both equal to 1 but this is untrue so I would advise that you determine the charges on the ions separately.
Finally, the data booklet clearly defines the process as an endothermic one with a positive value of ΔH. However, if you are using questions taken from the internet or non-IB sources it is quite possible that ΔHlatt will be defined exothermically (taking gaseous ions to make the solid) and also that the corresponding arrow in a Born-Haber cycle will point down to the ionic salt rather than up towards the ions as it will in your IB questions.
Tables 19 and 20 – Enthalpies of Solution and Hydration: make sure you know the difference between these two as they sound very similar.
Standard enthalpy change of (aqueous) solution is the enthalpy change associated with dissolving one mole of a solute in excess water to form a solution of infinite dilution at 298 K and 100 kPa; ΔHsol may be endothermic or exothermic.
e.g., NaCl(s) → Na+(aq) + Cl-(aq)
Standard enthalpy change of hydration refers to the enthalpy change that occurs when one mole of a gaseous ion is surrounded completely by water molecules to form a solution of infinite dilution at 298 K and 100 kPa; ΔHhydr is always exothermic.
e.g., Na+(g) → Na+(aq)
Table 21 – Strengths of Organic Acids and Bases: this table is one that I find myself discussing with my own students at length as it is a source of more information than immediately meets the eye. I have already mentioned the hidden data found within this table in the section dealing with Table 1 and the entry for the Henderson-Hasselbalch equation. Essentially, when faced with questions from the acids and bases topic that deal with salt solutions we need to use Table 19 to create new information. Typically, questions of this type are either about titrations (Paper 2) or buffers (Paper 3, Options B and D).
One of the most challenging questions students find is being asked to calculate the pH at the equivalence point of a titration. The main mistake is that students extract the pKa or pKb value of the weak acid/base referred to in the question. For example, if asked to determine the pH at the equivalence point in a titration of 25.0 cm3 of 0.1 mol dm-3 CH3COOH with 0.1 mol dm-3 NaOH, students will find the pKa of ethanoic acid (4.76) from Table 19 and then work with this value for the rest of their calculation. The key thing is recognising that at the equivalence point there is no acid left but rather a solution of the salt derived from that weak acid (in the case sodium ethanoate).
This is where a new problem arises because Table 19 contains no reference to the ethanoate ion and so students still feel that they should use the value for ethanoic acid. However, further thought reveals that ethanoate is the conjugate base of ethanoic acid and so we need a pKb value rather than the pKa of the acid. The following equation is vital:
pKw = pKa + pKb
which means,
pKa + pKb = 14 at 298 K
From this equation we can use the value for the pKa of ethanoic acid in Table 19 to calculate the pKb of the ethanoate ion as 9.24. We then need to create an expression for Kb and find the [OH-] in order to determine pOH and thus pH.
Titrations involving weak bases should be treated in the same regard. For example if we are titrating a solution of ethylamine (CH3CH2NH2) then we need to use the pKb for this compound in Table 19 (3.35) to determine the pKa of the ethylammonium ion (CH3CH3NH3+) as it is this species that is present in the salt solution formed at the equivalence point;
14 – 3.35 = 10.65
Table 23 – Ionization Constant of Water: just to point out that although the value of Kw increases as temperature increases and, therefore, the pH of water decreases (<7), the water is still neutral (yes, even at pH 6.5) as [H+] = [OH-].
Table 24 – Standard Electrode Potentials: this is a very important table that is referred to a lot in exam questions. There are a few points I want to highlight:
A. All the equations are written as reduction half-equations. This means the electrons appear on the left-hand side of the equation.
B. When a redox reaction occurs, there must be both a reduction reaction and an oxidation reaction. This means that when combining half-equations to create the overall reaction equation, one half-equation MUST be written backwards (i.e., as an oxidation).
C. In a spontaneous reaction (one where Ecell is > 0), the half-equation that is written backwards is the one most likely to undergo oxidation (i.e., the least likely to undergo reduction) and it, therefore, appears higher up the table then your second half-equation (i.e., has the less positive/more negative electrode potential).
D. One way to use the table quickly is to use the ‘anti-clockwise rule’.
i. Find the two half-equations you need to complete your overall equation.
ii. Start from the right-hand side on the topmost half-equation and move anti-clockwise towards the right-hand side of the bottommost half-equation. This gives you the direction the two processes occur in and makes it easy to decipher which species undergo oxidation and reduction.
e.g., write an equation for the overall reaction that occurs and calculate the cell potential when standard magnesium and silver half-cells are connected.
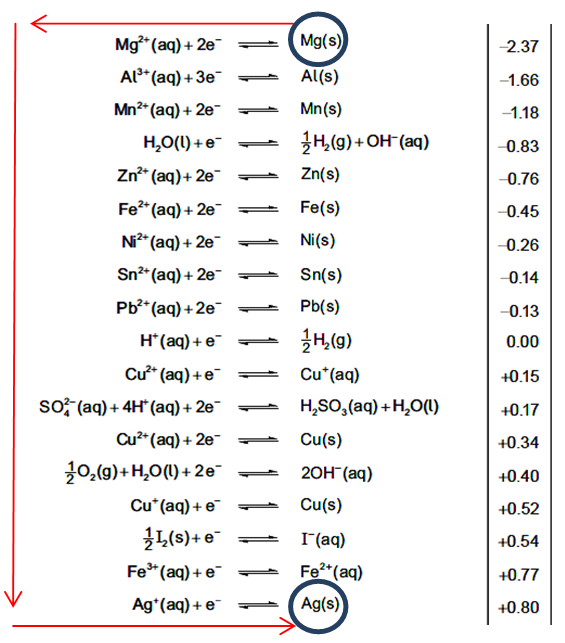
Moving anti-clockwise from the top right shows us that in the overall process, magnesium is oxidized to Mg2+ and Ag+ is reduced to Ag. Make sure to balance the number of electrons before combining the half-equations and reverse the sign of the topmost electrode potential.
Overall process: Mg + 2Ag+ → Mg2+ + 2Ag
Cell potential: -(-2.37) + 0.80 = +3.17 V
E. Note that lithium appears higher up the table than both sodium and potassium (not in table above, but in your booklets); that is to say that the oxidation of lithium is more favourable than that of either sodium or potassium. This is despite the observation that lithium reacts less vigorously with water than either sodium or potassium. So although we can reasonably say that lithium is less reactive than sodium and potassium, we can now say that lithium is a more powerful reducing agent than either sodium or potassium.
F. Given that oxidizing agents undergo reduction and reducing agents undergo oxidation, we can quickly identify both types of agent from Table 24:
• oxidizing agents appears on the left-hand side with the weakest at the top, e.g., group 1 metal ions, and the most powerful at the bottom, e.g., halogen elements.
• reducing agents appears on the right-hand side with the most powerful at the top, e.g., Group 1 metal elements, and the weakest at the bottom, e.g., halide ions.
G. be aware that several elements and certain species appear in more than one half-equation and it is quite possible to select the incorrect half-equation if you are rushing or are unsure. The two most problematic elements are copper and iron. Iron appears in two half-equations (reduction of Fe2+ or Fe3+) whereas copper appears in three half-equations (reduction of Cu2+ to either Cu+ or Cu, as well as the reduction of Cu+).
Table 26 – Infrared Data: in my opinion there is quite a lot of redundant information in this table, or at least, data that is highly unlikely to be needed in an examination. The first five wavenumber ranges provided for C—Hal bonds and the C—O bond are found in the fingerprint region and are likely to be difficult to isolate by eye. I can only imagine that if one of these ranges were needed then it would be very obvious from the question that a specific halogen atom was present in the molecule.
Similarly, I have seen very few questions, if any, that have included C≡C or N—H bonds; again, it should be clear in the question that these bonds are involved.
The main functional group bonds that are examined are the O—H and C=O bonds, and occasionally the C=C bond. The C—H bond is ubiquitous so expect to see peaks for C—H bonds in every spectrum. Make sure you stick to the range given, especially when deciding between C=O and C=C which appear in close proximity. Also, make sure you know can distinguish C—H bond peaks from O—H peaks as their ranges overlap. The C—H peak is, typically, jagged and made of multiple, smaller peaks whereas the O—H peak is, most often, a very broad, smooth curve.
Table 27 – 1H NMR Data: three or four things typically catch students out with this table. First, the table is, unhelpfully, split over two pages with the fairly common aldehyde signal on the second page (so it gets missed quite frequently and students choose the carboxyl proton instead). Second, the use of –CH2— in the ‘types of proton’ diagrams confuses students as they believe this signals is ONLY given by CH2 groups and therefore does not apply to CH3 groups (leading them to select R-CH3 signal at 0.9-1.0 ppm) for all CH3 groups.
Where CH2 is attached to an R group or simply an unattached bond, it is quite reasonable for the next attached atom to be hydrogen and therefore a CH¬3 group can give this signal. So the –CH2—Hal signal at 3.5-4.4 ppm could equally apply to both CH3CH2Br and CH¬3Br.
Thirdly, make sure you are aware of the different signals produced by hydroxyl groups (–OH) within aliphatic compounds (e.g., CH3CH3OH) and hydroxyl groups attached to aromatic rings, typically benzene rings (e.g., C6H5OH).
Finally, there are two signals associated with ester functional groups:
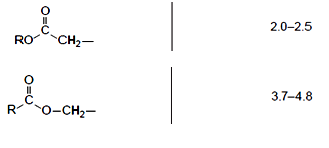
The difference between them is whether the hydrogens are attached to a carbon atom adjacent to the carbonyl (C=O) group of the ester or the single oxygen atom. These signals can help distinguish between isomeric esters which produce the same integration trace and splitting pattern such as ethyl ethanoate and methyl propanoate. The spectra for each of the two previously mentioned molecules contain a singlet (integration of 3), triplet (integration of 3) and a quartet (integration of 2). However, the CH2 group is located in a different environment in each molecule and so, in ethyl ethanoate, the quartet lies at a chemical shift of 3.7-4.8 ppm, whereas in methyl propanoate the quartet lies at 2.0-2.5 ppm; the singlet also appears in a different location :
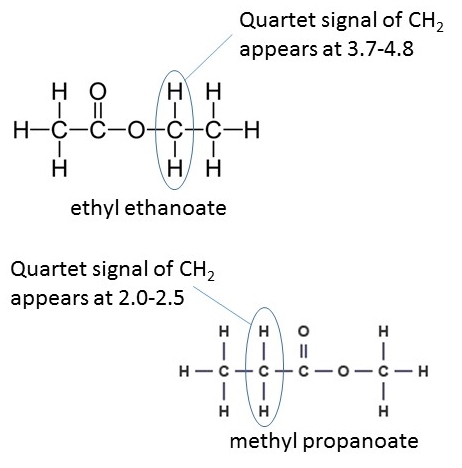
Table 28 – Mass Spectral Fragments Lost: the main thing to point out here is the list is far from exhaustive and you could easily (and most probably will) be asked to identify fragments not included in the table; the obvious omission in the phenyl group (C6H5) with a mass of 77. Additionally, it is possible for some of the fragment lost to have isomeric structures such as CH3O from a methyl ester or ether and CH2OH from a primary alcohol (both have a mass of 31).
Be aware the table refers specifically to fragments lost but you will frequently see questions asking you to identify the fragment responsible for a peak. The same table can be used but it is vital that you include a single positive charge on each fragment that produces a spectral peak.
Table 36 – Binding Energy Curve: it is most likely that if you have studied Option C – Energy, then you have performed nuclear fusion and fission calculations giving your final answer in joules using Einstein’s mass-energy equivalence. However, the unit used in binding energy curve in the data booklet is MeV (megaelectronvolt). The data booklet does not include a conversion from MeV to joules so one should be provided if needed. However, you should be prepared to work in MeV exclusively by using values from the graph. If you need to extract information from the graph then make sure you use a ruler to get fairly accurate values for the binding energies of the relevant nuclei.
Table 37 – Representations of Some Medicinal Molecules: it is interesting to note that the structures of both ibuprofen and paracetamol are given in this table despite neither being named molecules on the IB specification for Option D – Medicinal Chemistry. My instinct is that they have been included in order to ask questions on:
• functional group similarities/differences with aspirin
• spectral analysis (IR, NMR and mass spec)
• determination of water/lipid-solubility
If you study Option D then you should be make sure you are familiar with the functional groups, likely water/lipid-solubility and major spectral indicators for any/all of the molecules in this table.
Be sure to give us a shout if you have any questions!
Warp Drive Tutors, Inc. has been developed independently from and is not endorsed by the International Baccalaureate Organization. International Baccalaureate®, Baccalaureat International®, Bachillerato Internacional® and IB® are registered trademarks owned by the International Baccalaureate Organization.