Written by Aidan; Aidan is available for private tutoring in IB®, A Level, and MYP Mathematics
Like many countries, the UK has just gone through a particularly turbulent time in terms of the awarding of grades to school leavers. For A-levels and GCSEs, teachers were asked to rank their students in order of ability – a very difficult task. Naturally, it led to some students feeling pleased and some feeling disappointed – as would a normal year of exams. But randomness means that grades – whether awarded by exams or by teachers – are limited as an indicator of underlying ability, and neither system will provide a perfect assessment of a group of students. This blog post examines why inherent randomness interferes with accurate predictions, using coin tosses to demonstrate basic statistical analysis.
Imagine I ask you to play a game. The game is very simple: you’re going to flip a coin, and if it shows heads then you win and if it shows tails then you don’t.
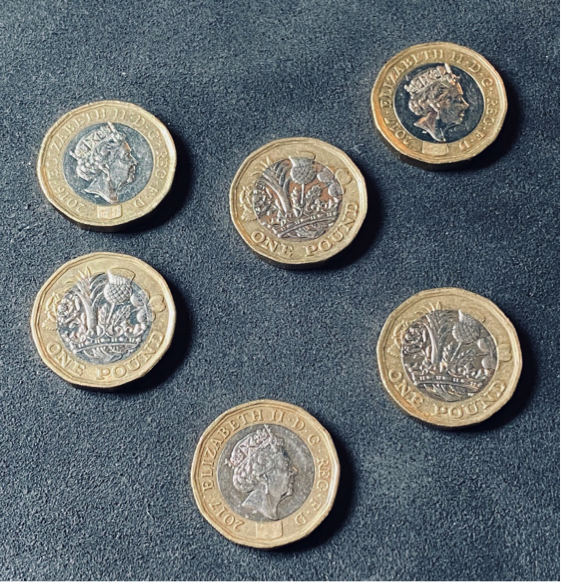
You get to choose which coin to flip from a selection of coins. They are all different, and ALL of them are biased, but you can’t tell from looking at them how biased, or whether they are biased in your favour or not. All that you really know is that some coins will be better for you and some will be worse. You want to pick the coin that will be best for you.
There are lots of situations in real life that reflect this: imagine that you have to choose between different options on a menu. You can’t guarantee that a particular dish will satisfy you based on what you see on the menu but some dishes are more likely to satisfy you than others. Similarly, when employers are trying to recruit new staff, they want to maximise their chances of recruiting someone who will prove to be good at the job. In each case, there is a need to make a judgment about the underlying quality of something based on limited information.
In our situation with the coins, we will imagine the biased coins are analogous to students. A coin that is biased very strongly in favour of heads is like a strong student – you might call this coin “A grade”. Alternatively, a coin that is biased less strongly in favour of heads is a weaker student –this is your “B grade” coin – and so on. Your goal is to make sure that you work out which coin (or student) is the “best”, that is, will display the most favourable outcomes on the exam.
In order to evaluate the coins, you might run some experiments on the coins to choose which coin is the best for you to use. For example, you might flip every coin 50 times and then choose the coin with the best track record.
This graph shows the result of doing just that sort of experiment using one of our biased coins:
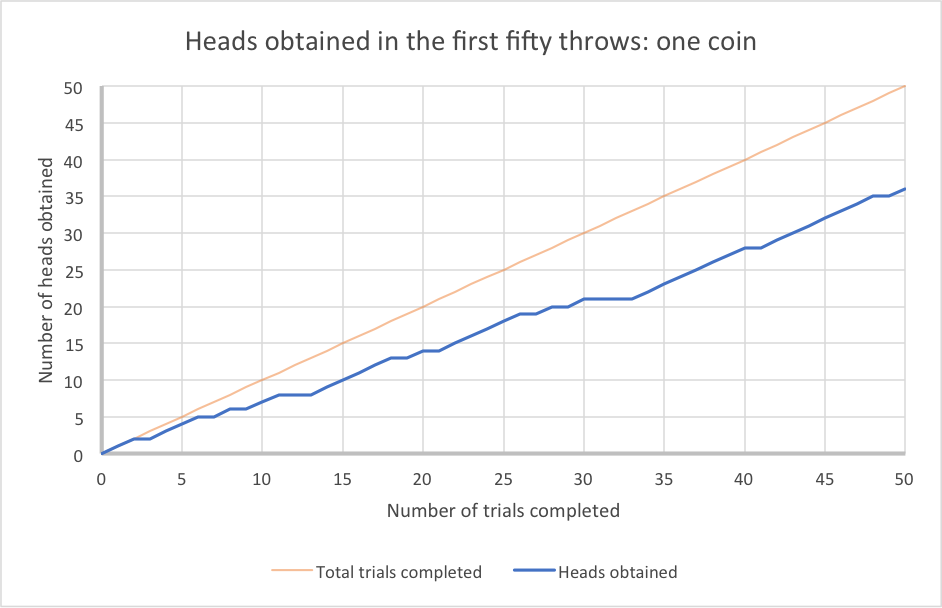
In our experiment, we completed 50 trials. Notice how the blue line rises irregularly. This is because every flip of the coin is a random event, independent of the flips that precede it.
You might think – because the coin came up heads on 36 out of 50 experiments – that the chance of this particular coin showing heads is about 72%. But will it still come up heads 72% of the time if we repeat the experiment?
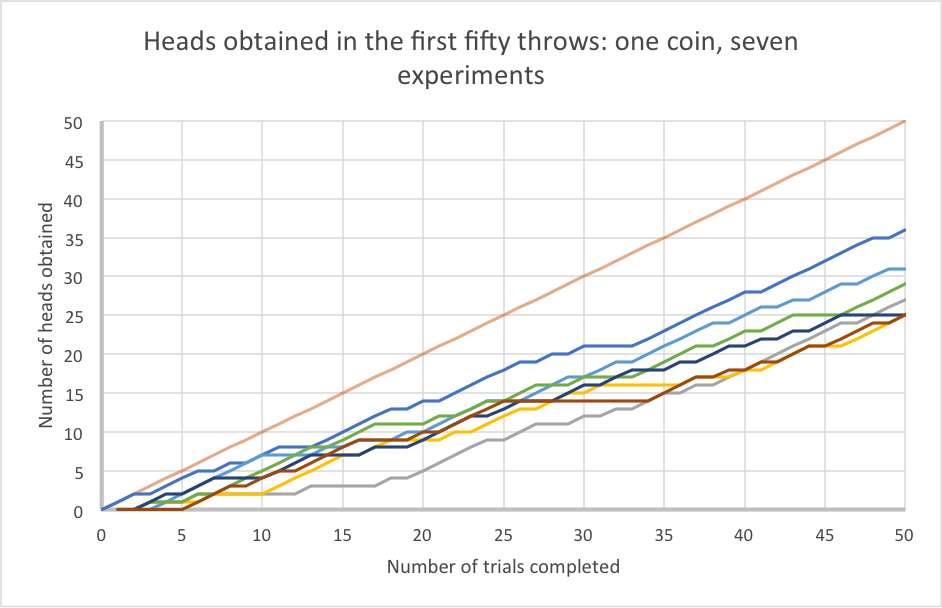
This next graph shows the same thing but with the whole experiment repeated seven times (using the same coin, and including the original results). Notice that because each set of fifty experiments is a collection of random events, the overall outcome is different every time.
If you’ve studied some statistics, you may know that we would say that any coin has a certain probability of showing heads. This is a number between 0 and 1, where 0 represents impossibility and 1 represents certainty. The probability is the proportion of trials which you expect to have a given result. So a probability of 0.6, or 60%, means that I expect 60% of trials to have a certain outcome. Often we consider experimental probability: where, for example, we would say that if something has happened 8 times of 10 in the past, we estimate its probability of happening to be 0.8 or 80%. This is also known as relative frequency. We can plot relative frequency (i.e. the proportion of trials that have had a particular outcome) for the coin flip experiment. You will see that as the number of trials in the experiment increases, the graph starts to settle down a bit.
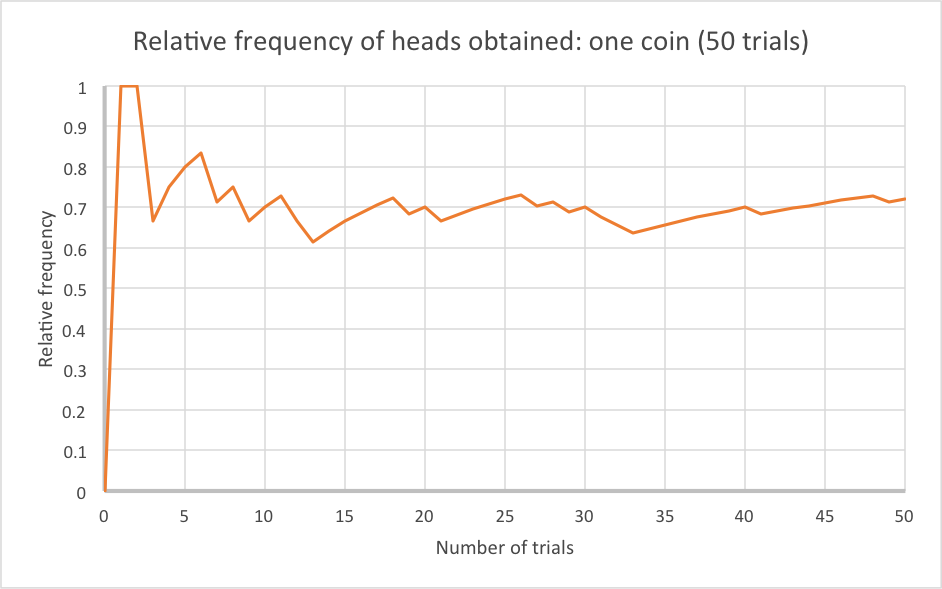
If I increase the number of trials by an order of magnitude, the graph becomes even more stable:
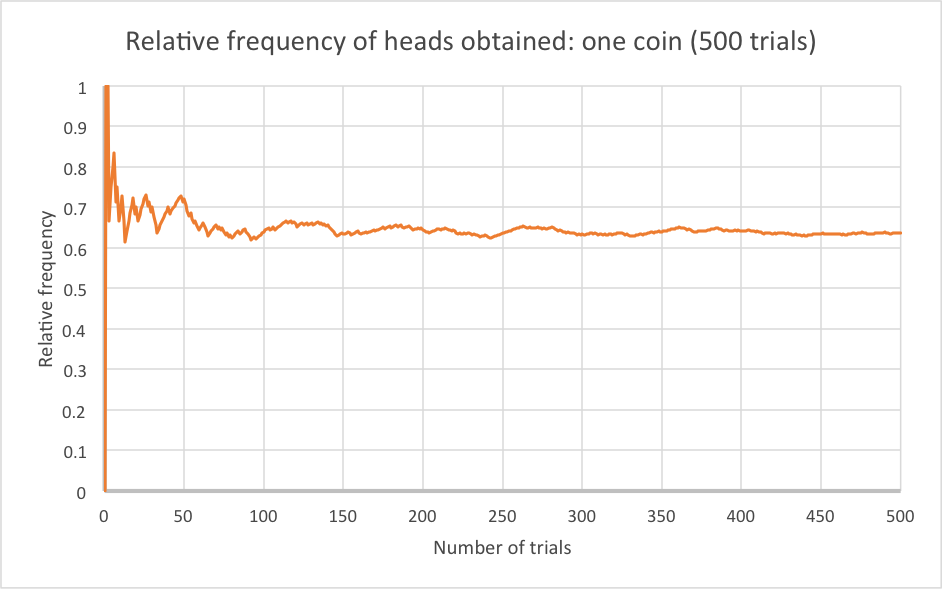
This stability is due to the law of large numbers. It states that as a sample grows, the mean of the sample gets closer to the mean of the whole population. You can see the law of large numbers demonstrate itself if we next try this over seven experiments with 500 throws, as shown in the graph below.
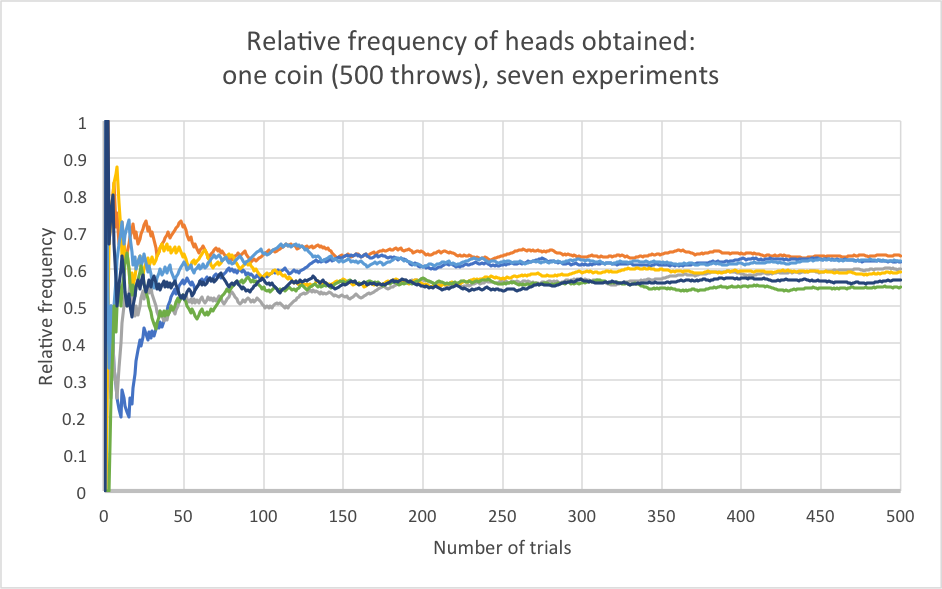
The important thing to note here, however, is that each of these seven – very large – trials came from the same coin. But even after 500 trials, they don’t settle down to the same point. You might expect, since 500 is a large number, that the relative frequency from each trial would be about the same after this number of coin flips, but (if you have studied the appropriate topics) you can use the Binomial Distribution and the Central Limit Theorem to show that the standard deviation in relative frequencies generated by this sort of experiment using a coin is approximately 2% either side of the true value – i.e. that if the true probability is 0.6, you will get answers between 0.58 and 0.62 in roughly two-thirds of these 500-flip trials. Around one in fifteen 500-flip trials will give you an answer that is wrong by over 4%: i.e. below 56% or above 64%. If your grasp of statistics is strong, the working for this is provided at the bottom of the blog.*
We still don’t know, therefore, what the true value of the probability of getting a head with this coin is. In fact, that value cannot be determined experimentally – and this is the first big conclusion in this game: the underlying true values are unknowable. So the first problem we have to accept in this game is that it is impossible for you to know the true probability that each coin will show heads, and so therefore it is impossible for you to know with certainty which is the best coin.
Let’s now imagine that you’ve chosen a coin. And perhaps your friend has also chosen a coin. Let’s even suppose you’ve chosen the better coin: your coin shows heads 55% of the time and your friend’s shows heads 45% of the time. You’ve got an advantage of 10% over your friend, so you might feel fairly confident of being better off – of winning more than them overall. But let’s suppose you each flip your coin once. This table predicts the probabilities of different possible outcomes:
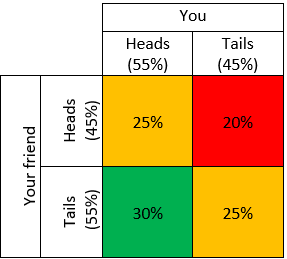
What we see is that you will outperform your friend (i.e. get Heads when they get Tails) 30% of the time. But 50% of the time you will have the same outcome, and 20% of the time you will do worse, even though you have the better coin.
This is the second big conclusion: because the game contains elements of chance, the players don’t always come out in the ‘right’ order.
So the right order is unknowable, and the game might not put people in the right order anyway. Furthermore, if you were to play the game twice, you wouldn’t necessarily get the same outcome.
What does this tell us about exams? Not everybody enters exams with equal prospects. Some revised better. Some work harder from the start. Some people naturally find some subjects easier. Let’s imagine though, that you at least believe that there is a true level of performance that you think each examinee should obtain. It remains the case that the true order, like the true order for the coins, is unknowable. No number of experiments will tell us for certain what the actual strength of the candidates is. Furthermore, because the exam itself is an experiment containing randomness (Do the questions happen to play to your strongest topics? Is one of the essays like one you prepared last week? Are you sitting near a noisy radiator that keeps distracting you?), it isn’t necessarily the case that the outcome of the exam will reflect the “right order”. And if we were to rewind the clock and run the exams a second time, the outcome of the exam would be different, because elements of it are simply unpredictable.
So exams are imperfect. When results are published, some students will have done well compared to their expectations and some will have done poorly. That might be because luck helped them to do well, or worked against them on the day. It might also be because they didn’t really realise how strong a candidate they were, or because they had an inflated sense of their own ability. Whatever the result, there’s no point in being angry at the exam, the school, or yourself for the fact that something fundamentally unknowable was not precisely determined by a process which contains inherent randomness.
For those of you that were due to sit exams this year but instead received Centre Assessed Grades like my students here in the UK: please know that your teachers worked earnestly to try to order you by likely exam outcome. But this is a difficult task – even more complicated than that of choosing the best coin – because whilst the coins didn’t change over time, students were all developing at different and varying rates. Teachers across the world have used their best professional judgment to try to get their students into order. But it is inevitable that this process will not replicate the outcome of the exams precisely, because even running the same exams twice would not necessarily produce the same results. So as with any exam year, some of you will be disappointed and some of you will be pleased. You might think that the final results aren’t fair because they don’t reflect what you think the final grade order should be. But just because a process leads to disappointment, it doesn’t follow that it’s unfair, and similarly, there’s no guarantee that a fair process would lead to satisfaction.
There’s no denying that the process of getting exam results can be disappointing and stressful. And whilst knowing that the process contains randomness might not be reassuring, it’s a fact concerning assessment which we all have to get to grips with. So wherever you are in the world at this time, and no matter how your grades were assessed, if you’re trying to work out whether to re-sit, or appeal, or take a year out, or to change your plans – try to do so understanding that whatever steps you take, chance will always play a part in deciding the outcome.
* Let  be the number of times heads appears in a set of n flips of a coin which shows heads with probability
  . Then
  ; it follows that
  and
and  . Let
. Let  .
.
The relative frequency of heads is given by  . Since n is large, the Central Limit Theorem tells us that if
  and
and  then
then  . Substituting in our expressions for
  and
and  gives
gives  .
.
Taking as an example a 500-flip experiment on a coin with a 60:40 bias towards heads, i.e. where  , tells us that
  ; i.e. the relative frequency will be normally distributed with mean 0.6 and standard deviation 0.0219.
From this, we observe the following facts:
 : this means that only 64% of experiments will tell you to within 2% the coin’s true value.
 : almost 7% of experiments will give you a relative frequency that is more than 4% away from the true value.
Warp Drive Tutors, Inc. has been developed independently from and is not endorsed by Cambridge Assessment International Education. A-Level, GCSE and iGCSE are registered trademarks owned by Cambridge Assessment International Education.
Warp Drive Tutors, Inc. has been developed independently from and is not endorsed by the International Baccalaureate Organization. International Baccalaureate®, Baccalaureat International®, Bachillerato Internacional® and IB® are registered trademarks owned by the International Baccalaureate Organization.